Viewing Per Node Metrics for Table Activities
Describes how to view per node metrics for table activities using the Control System and Grafana.
About this task
This section describes how to view the metrics as charts and lists in the Control System. For information on visualizing the metrics in the Grafana UI, see Metric Visualization
Procedure
- Log in to the Control System and go the Metrics tab in the node information page.
-
Select Activity by Tables from the drop-down menu.
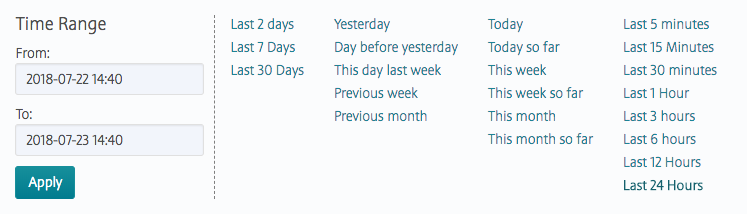
By default, the page displays charts that show metrics for the last 24 hours. You can select a preset or specify a custom time range.
You can also zoom in (by clicking and dragging the cursor in the pane) for a more granular view. Click Zoom Out to expand time window or click: to shift time window forwards.
 to shift time window backwards.
The charts show metrics for the node across tables. Click
 associated with
the chart to view information about the graph. Click
associated with
the chart to view information about the graph. Click  to display the
Customize Active Charts window, where you can
select charts to display and remove from the
Available and Selected
lists. You can view up to 6 charts at a time in the page.
to display the
Customize Active Charts window, where you can
select charts to display and remove from the
Available and Selected
lists. You can view up to 6 charts at a time in the page. You can switch to the list view by clicking
 . In the list view,
you can:
. In the list view,
you can: - Click the table name to go to the metrics page for the table.
- Select one or more tables and switch to charts view (by clicking
 ) to
visualize metrics for the selected tables only.
) to
visualize metrics for the selected tables only.
For the complete list of metrics that you can view at both the node and table levels, see Viewing Table Metrics in the Control System.