Monitoring Tables
Explains how to monitor table alarms and view table metrics in the Control System.
Monitoring Table Alarms in the Control System
About this task
Viewing Throughput by Operation Type Using the Control System
Procedure
- Go to the Summary tab in the table information page. The Throughput - By Op Type pane displays a graph for the following operations on the table in the last hour:
- Gets
- Puts
- Scans
- Increments
- Appends
- Checks and Puts
- Updates and Gets
- Go to the Summary tab in the index details
page.The Throughput - By Op Type pane displays a graph for the following operations on the index in the last hour:
- Puts
- Scans
Visualizing Table Metrics in the Control System
About this task
In the Control System, you can visualize node-level metrics for table operations on a node. You can view charts that show metrics for all tables across all nodes, metrics per table aggregated across nodes, metrics per table per node, and metrics per node across tables. In addition, you can view metrics for activity by indexes and for the table and its secondary indexes.
For the full list of metrics (and associated charts/columns) that you can view in the Control System, see Viewing Table Metrics in the Control System.
Procedure
- Go to the Metrics tab in the node information page
and select Activity by Tables from the drop-down
menu.
In this tab, you can view charts/columns that show metrics for all table operations on the node, operations on streams, and other node metrics described here.
- Go to the Metrics tab in the page.
In this tab, you can view charts/columns that show metrics per node for all tables.
- Go to the Metrics tab in the table information page.
In this tab, you can view charts/columns that show operations on the table and its secondary indexes across nodes.
- Go to the Metrics tab in the index details
page and select Activity by Nodes from
the drop-down menu.
In this tab, you can view charts that show all index operations and index operations per node.
You can select the charts to view by creating a custom chart Board or by modifying an existing Board. See Creating a Custom Board for the Charts or Editing a Chart Board for more information.
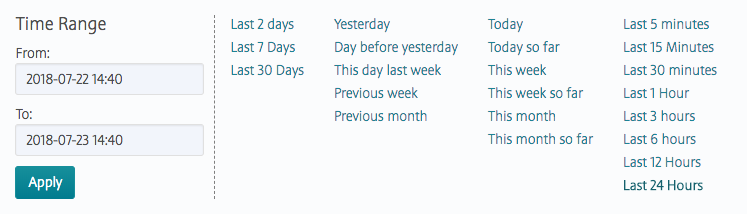
The charts on the page show the metrics for the last 24 hours by default. You can select a preset or specify a custom time range.
 to shift time window forwards.
 to shift time window backwards.
You can switch to a list view, where available, by clicking  . In this view,
you can select metrics to view by clicking
. In this view,
you can select metrics to view by clicking  . See
Adding and Removing Columns from the List View for more
information.
. See
Adding and Removing Columns from the List View for more
information.
In the list view, you can:
- Filter the list by clicking
 .
. - Click the node name to go to the node-level metrics page.
- Select one or more nodes and switch to charts view by clicking
 to
visualize metrics for the selected nodes only. The legends for the
charts reflect the selected nodes.
to
visualize metrics for the selected nodes only. The legends for the
charts reflect the selected nodes.
The chart and list views allow you to detect and diagnose bottlenecks and performance issues on individual tables and nodes. You can use the charts for measuring the throughput and latency of different RPC operations on a table and for determining which operations on a table are slow or which tables are most frequently accessed.
- Suppose your node is busy and you are noticing intermittent latency spikes on your table. You can compare throughput and latency in the Metrics tab of the table information page and investigate if the latency spike is due to node being very busy or node having high CPU utilization by switching to the list view from where you can navigate to the Metrics tab of the node details page.
- Suppose your index queries take minutes instead of seconds to complete. You can compare the get latency percentile with the scan read/response in the Metrics tab of the table information page by zooming in to the area where you see the spike. Switch to Activity by Index to view the index vs primary table scans where you can determine whether excessive scan load went to the primary table.
- Suppose you are noticing latency spikes on one of your table as a result of a lot of activity on another table. Observe the get latency percentile spikes in the Metrics tab of the table information page and switch to Activity by Node list view to identify the nodes with high overall aggregate table RPC load and node IOps. Select the saturated nodes in the list view and switch to the chart view. Go back to the list view and click the saturated node to navigate to the Metrics tab of the node details page. Switch to Activity by Tables to determine the most active table.
Viewing Secondary Index Metrics
About this task
You can visualize the secondary index metrics in the Control System.
Procedure
- Go to the Metrics tab in the table information page and select Activity by Indexes from the drop-down menu to view all index-related activity on the table.
- Go to the Metrics tab in the secondary index page to view metrics for index-related activity across tables or per node.
By default, the page displays metrics for the last 24 hours. You can select a preset or specify a custom time range.
- to shift time window forwards.
- to shift time window
backwards.
The page displays charts by default. When viewing activity
by nodes, you can switch to a list view by clicking and return to
charts view by clicking .
You can select the charts to view by
creating a custom chart Board or by modifying an existing
Board. See Creating a Custom Board for the Charts or Editing a Chart Board
for more information. Click the  associated with the chart to view information about the
graph.
associated with the chart to view information about the
graph.
The list view shows the metrics in the columns. You can
customize the columns by clicking . See Adding and Removing Columns from the List View for
more information. In addition, you can:
- Click the column name to sort the table by that column.
- Click the node name to go to the metrics page for the node.
- Click one or more checkboxes next to the node name and switch to the charts view to visualize metrics for the secondary index activities on those nodes only.
Viewing Region Distribution
Procedure
- Summary tab in the table information page to view the region distribution for a table.
- Summary tab in the index details page to view the region distribution for a secondary index.
- Hostname of the node
- Number of regions on the node
- Total size of data (across regions) on the node