Data Fabric Monitoring Storage Options
Describes various storage options for Data Fabric Monitoring. The Control System relies on data-fabric monitoring components to display metrics, but can function without the monitoring components. Using data-fabric monitoring to store logs is optional.
The following installation options are available for metric storage with OpenTSDB and log storage with Elasticsearch. You can store logs and metrics on a non-data-fabric cluster but this scenario is not supported by data-fabric.
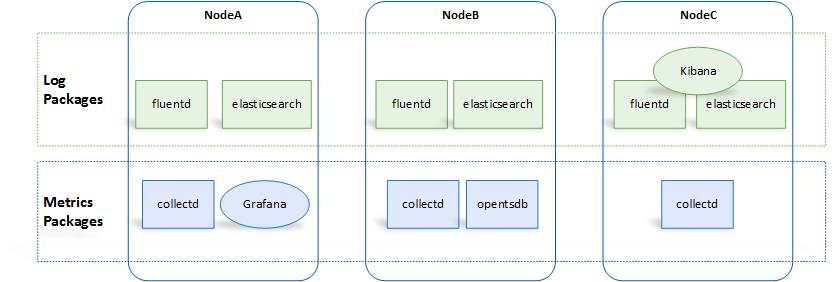
Store Metrics and Logs on the Monitored Cluster
You can store metrics and logs on the nodes in the same data-fabric cluster that you want to monitor. Note that installing Grafana is optional.
Store Metrics and Logs on a Storage Cluster
You can store metrics and logs for the data-fabric cluster that you want to monitor, on nodes in a different data-fabric cluster.
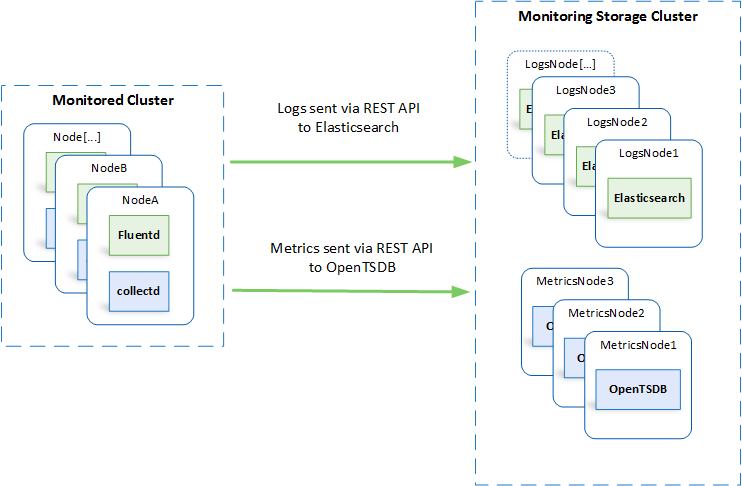
In this case, Kibana and Grafana can be installed on either cluster.
Use a Single Cluster to Store Monitoring Data for Multiple Clusters
You can store metrics and logs for more than one data-fabric cluster on a shared set of nodes. With this option, a single dashboard can monitor multiple clusters.
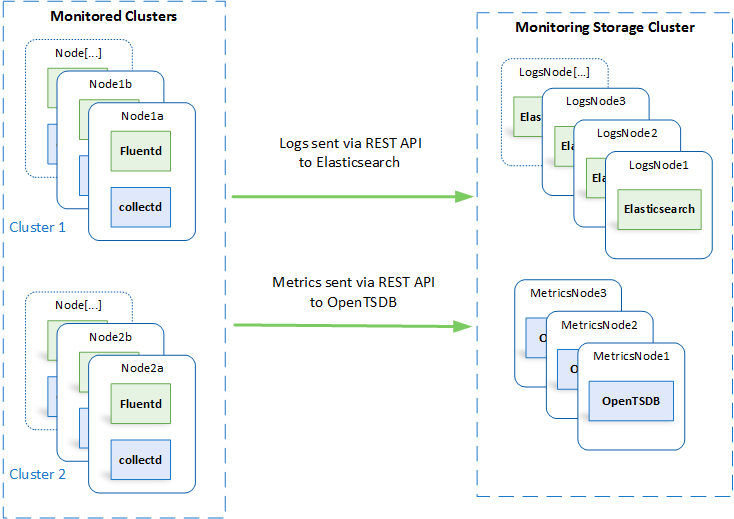
In this case, Kibana and Grafana can be installed on any of these clusters.