Using Visualization Packages in Zeppelin
Apache Zeppelin supports the Helium framework. Using visualization packages, you can view your data through area charts, bar charts, scatter charts, and other displays. To use a visualization package, you must enable it through the Helium repository browser in the Zeppelin UI. Like Zeppelin interpreters, Helium is automatically installed in your Zeppelin container.
About this task
ultimate-pie-chart package. Zeppelin 0.8.0 is supported
starting in MapR Data Platform
MapR Data Science Refinery 1.3. If you are using an earlier release of the
MapR Data Science Refinery product, see earlier versions of the
documentation for instructions.IMPORTANT The Apache Community provides and supports the visualization
packages available through the Helium repository browser. The MapR product does not provide support for
these packages.
Follow these steps to enable a package:
Procedure
-
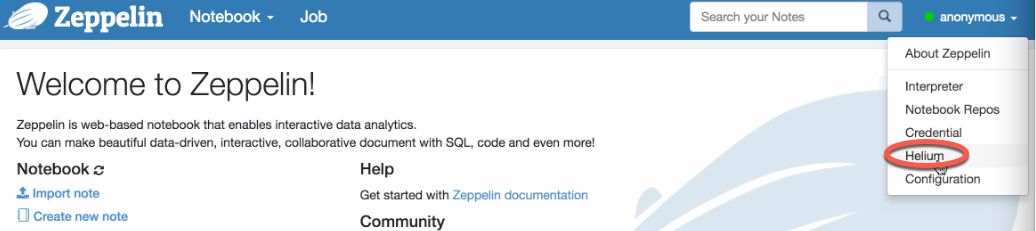
Open the Helium repository browser by selecting the
Helium tab in the main menu of the Zeppelin UI:
-
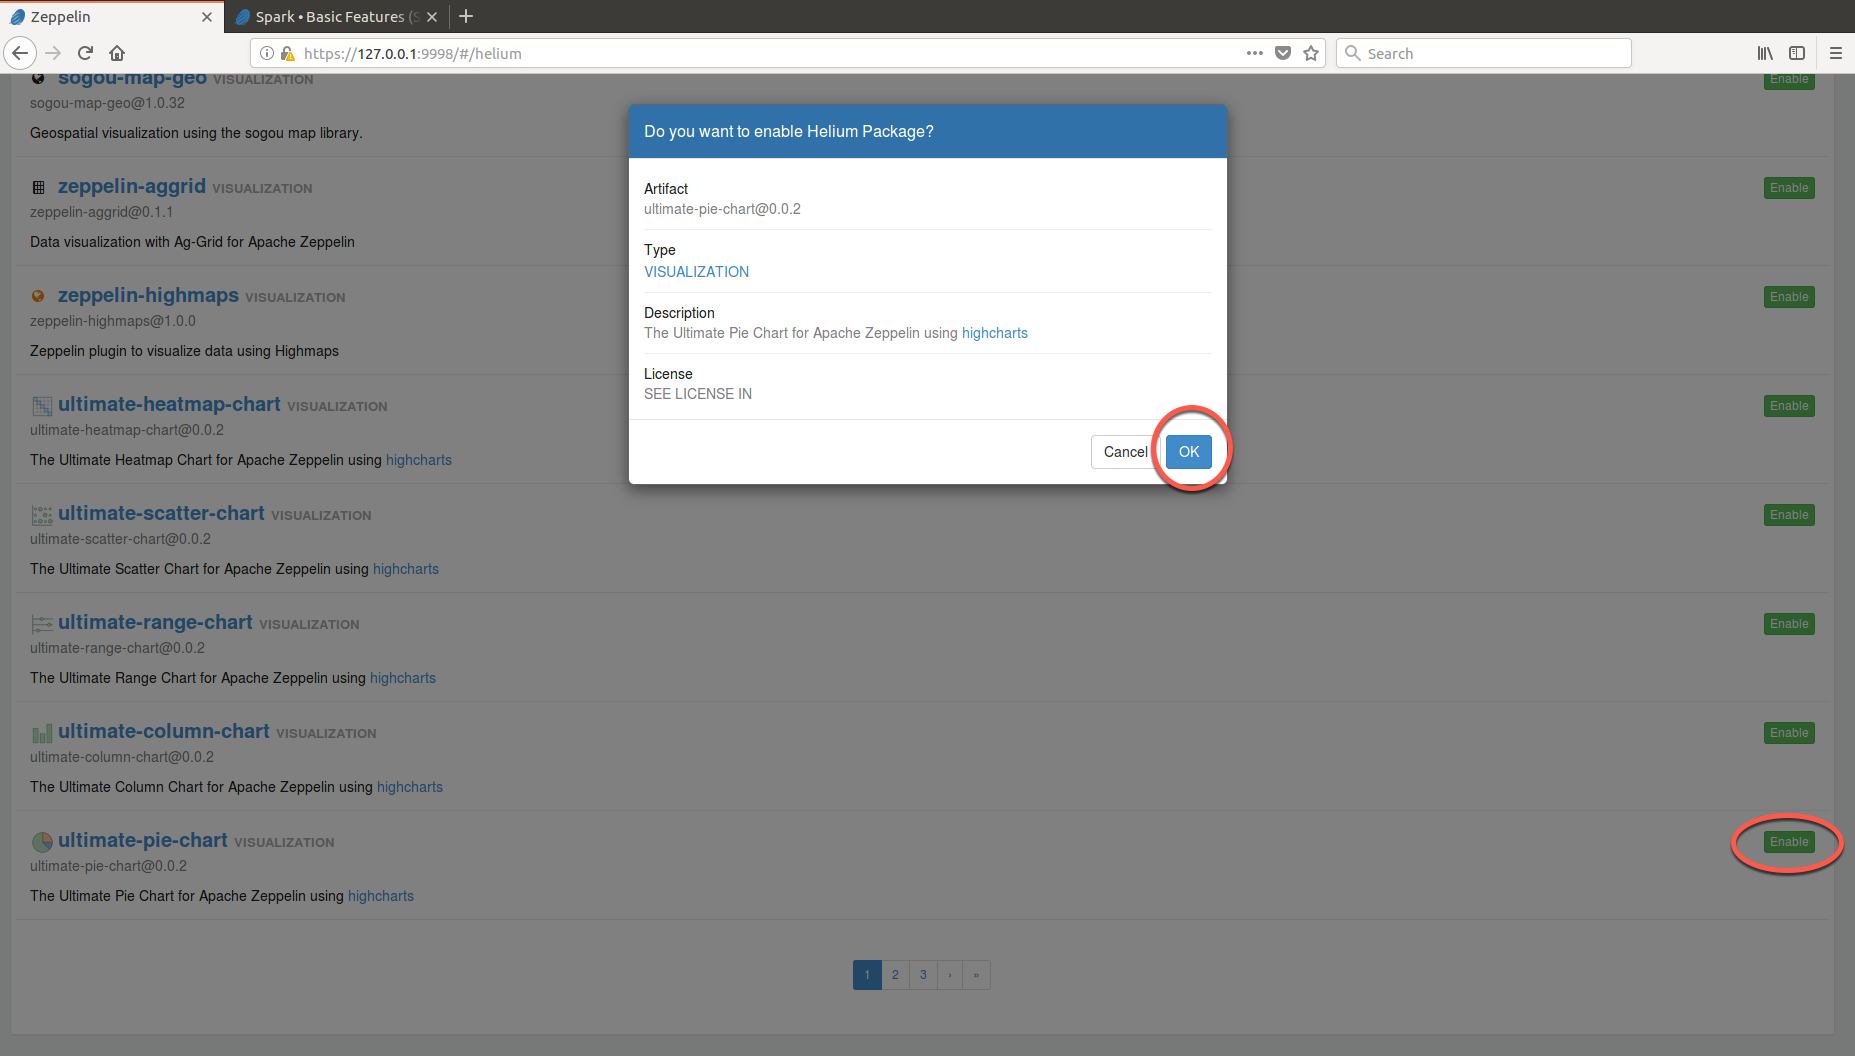
Locate your package, click Enable, and then click
OK in the popup window:
The time it takes to enable a package depends on your internet connection speed.
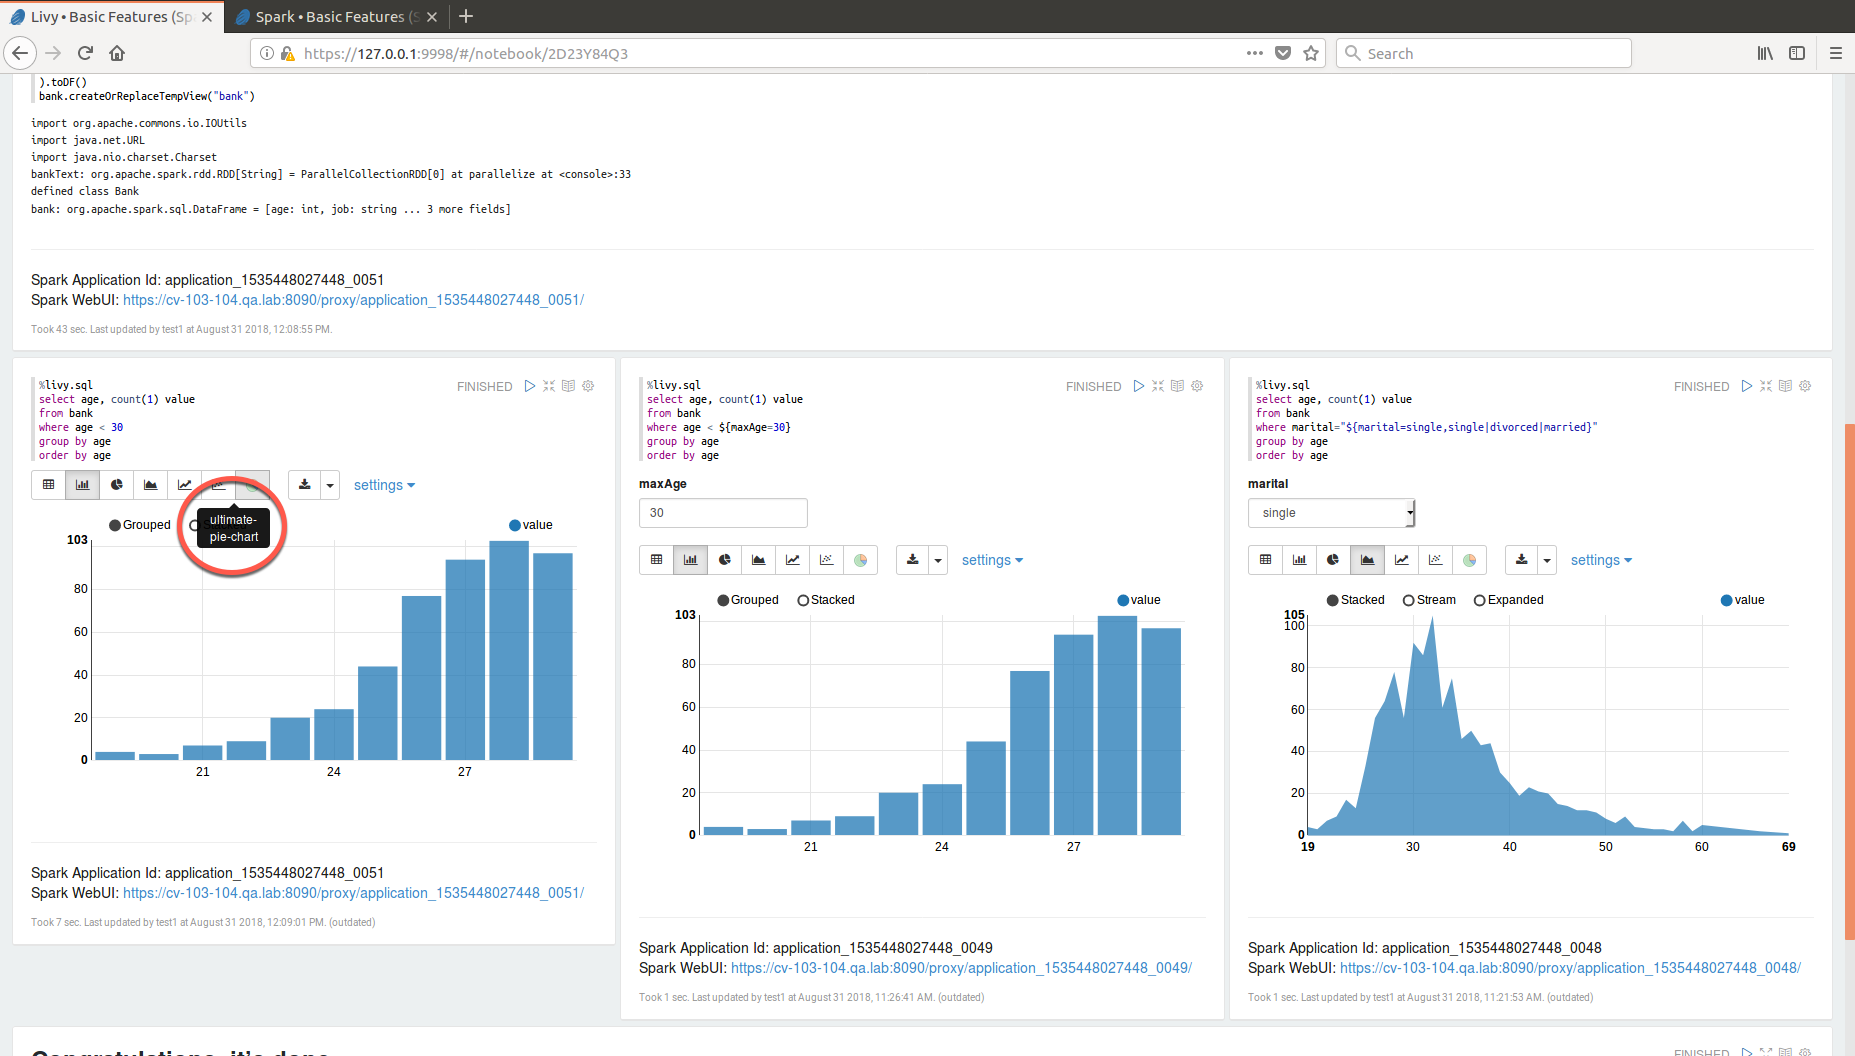
What to do next
ultimate-pie-chart package: