Monitoring YARN
Procedure
Log in to the MapR Control System and:
- Click Overview to view the following in the
YARN pane:
- Number of node managers, running applications, and queued jobs.
- Memory and CPU utilization metrics.
- Go to the service information
page for YARN. The YARN information page displays the following panes:
- Summary
- Displays:
- Total number of nodes and number of active and unhealthy nodes.
- Allocated, pending, and reserved number of Resource Manager containers.
- Top Queues by CPU Utilization
- Displays the queues that utilize the most CPU (in percentage).
- Top Queues by Memory Consumption
- Displays the queues that consume the most memory (in percentage).
- Applications
- Displays the number of submitted, completed,
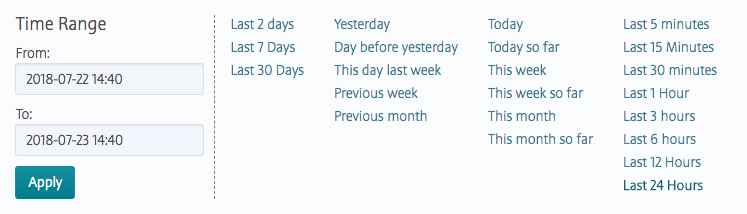
running, pending, and failed applications during a selected date
and time range. You can select a preset or specify a custom time
range.
You can zoom in (by clicking and dragging the cursor in the pane) for a more granular view. - Resource Manager (CPU)
- The number of cores allocated and used by
Resource Manager during a selected date and time range. You can
select a preset or specify a custom time range.
You can zoom in (by clicking and dragging the cursor in the pane) for a more granular view. - Resource Manager (Memory)
- The amount (in MB) of memory allocated and
used by Resource Manager during a selected date and time range.
You can select a preset or specify a custom time range.
You can zoom in (by clicking and dragging the cursor in the pane) for a more granular view.
NOTE The metrics collection infrastructure must
be installed during installation to visualize the metrics in
the various panes. If the metrics collection infrastructure
is not installed, perform an Incremental Install to install the metrics
collection infrastructure.